3 图形
代码提供:
张洛宏 徐颖 陈宇祥 柯颖婷 黄国政
主要内容: -散点图 抖散图 箱线图 直方图 密度图 提琴图 山峦图 椭圆图 2D密度图 -图的分面 -图上标注文本
load(file = "core.Rdata")
class(core)
## [1] "tbl_df" "tbl" "data.frame"3.1 ggplot2
3.1.1 散点图 抖散图 箱线图 直方图
散点图
ggplot(data=core,aes(x=height,y=weight))+
  geom_point()
#设置颜色
ggplot(data=core,
       aes(x=height,y=weight,color=gender))+
  geom_point()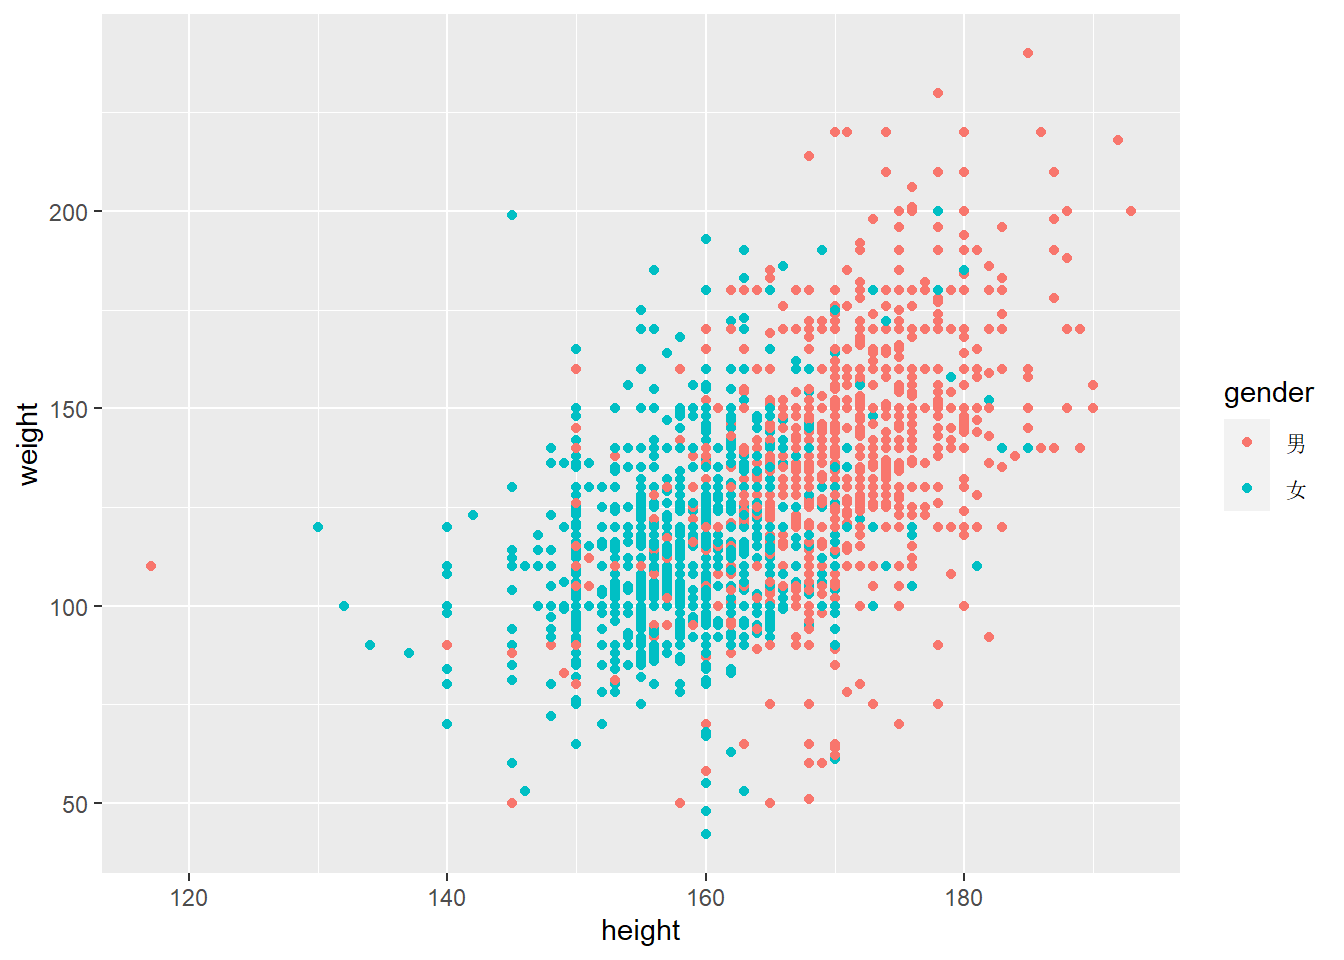
抖散图
ggplot(data=core,aes(x=educ,y=log(income)))+
  geom_point()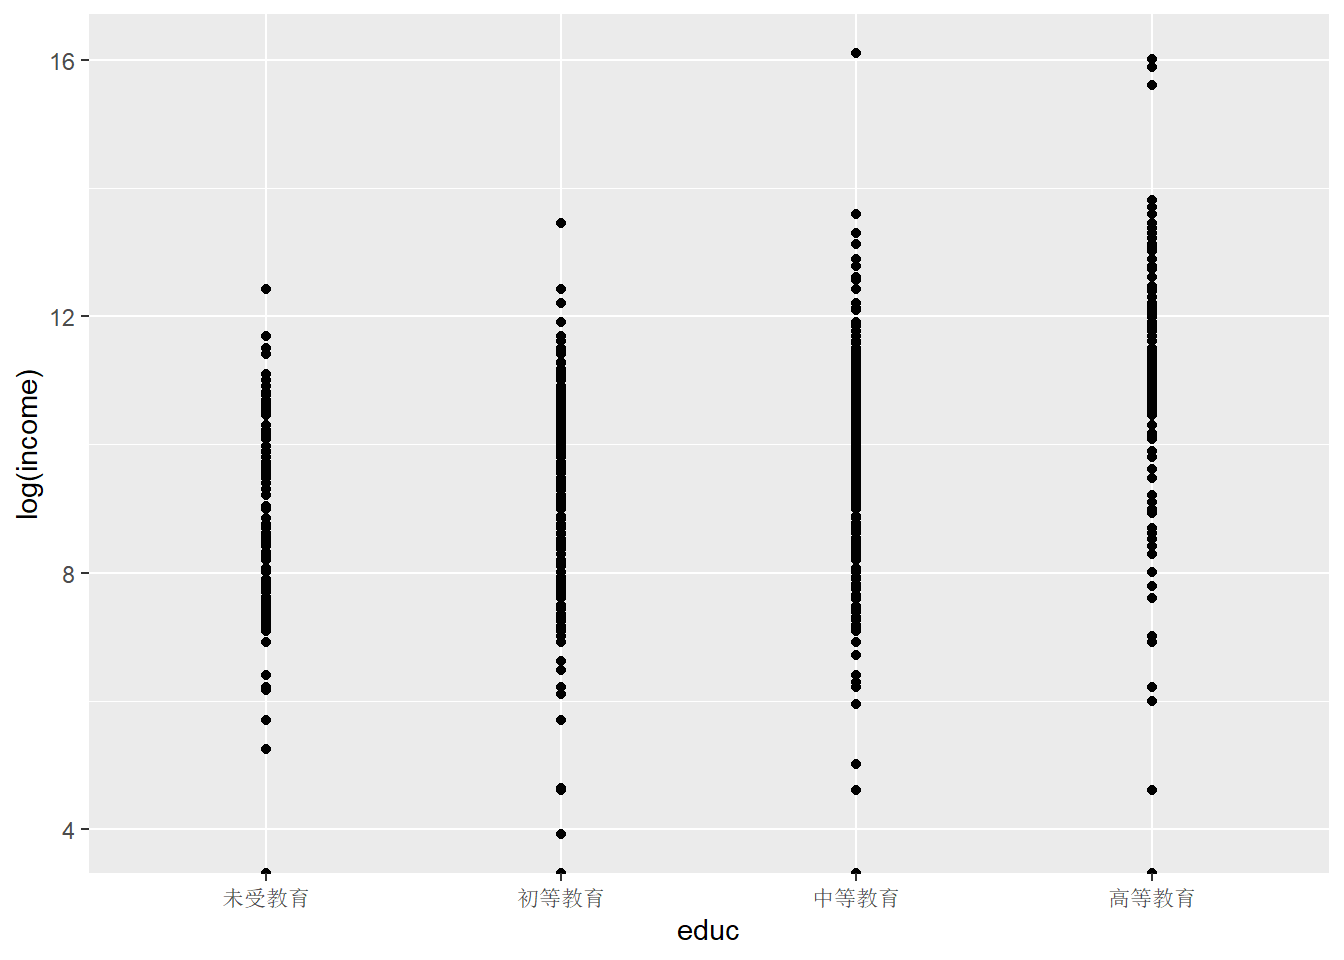
core %>%
  ggplot(aes(x = educ, y =log(income))) +
  geom_jitter() #为每个点的位置增加了少量的随机变化,能够处理点相互重叠的问题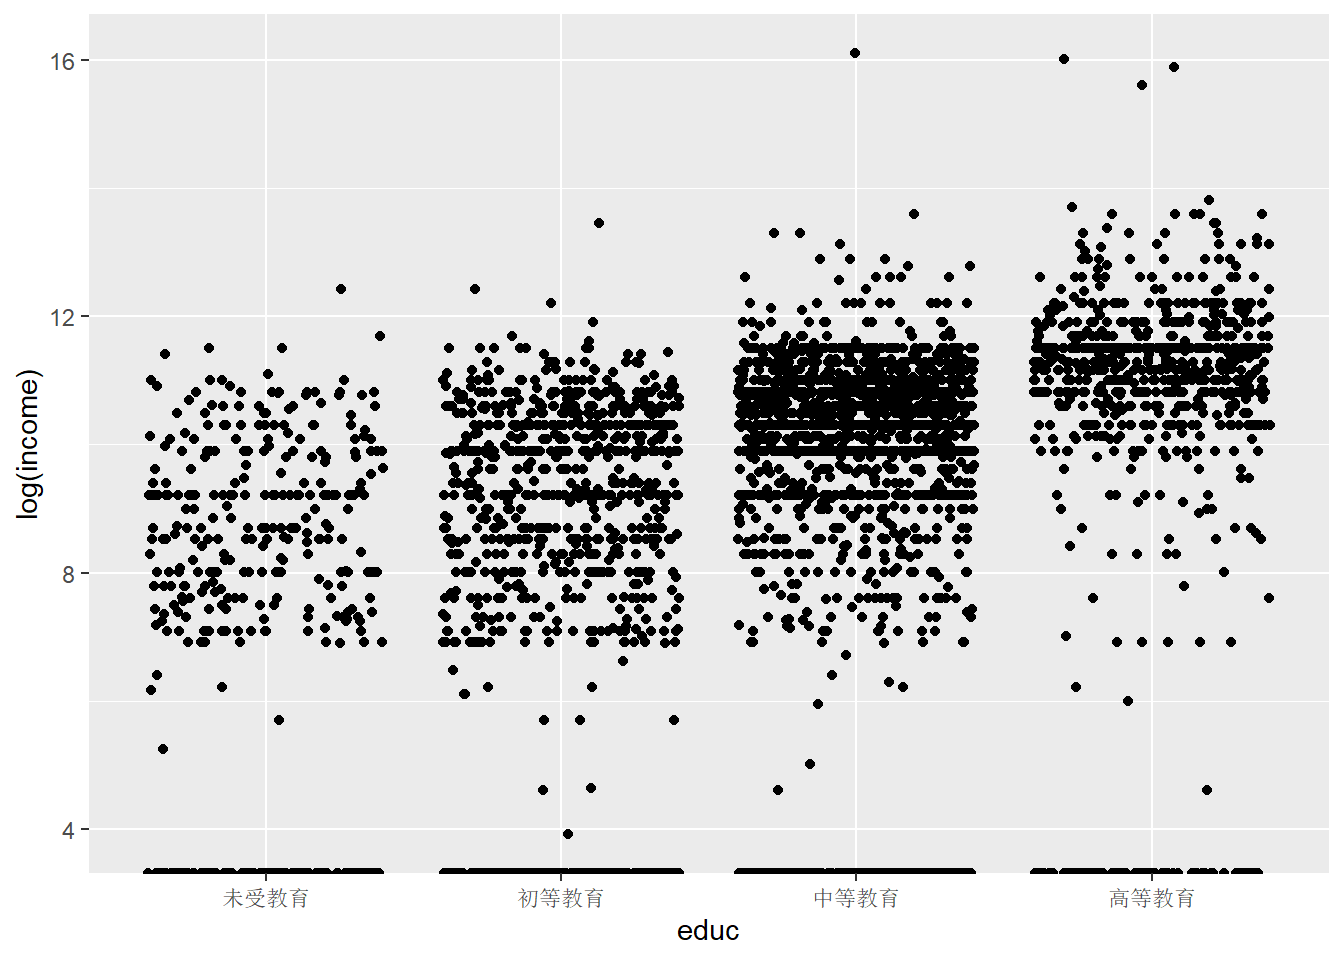
箱线图
ggplot(data=core,
       aes(x=educ,y=log(income),fill=stype,color=stype))+
  geom_boxplot(alpha=0.7)
## Warning: Removed 624 rows containing non-finite values (`stat_boxplot()`).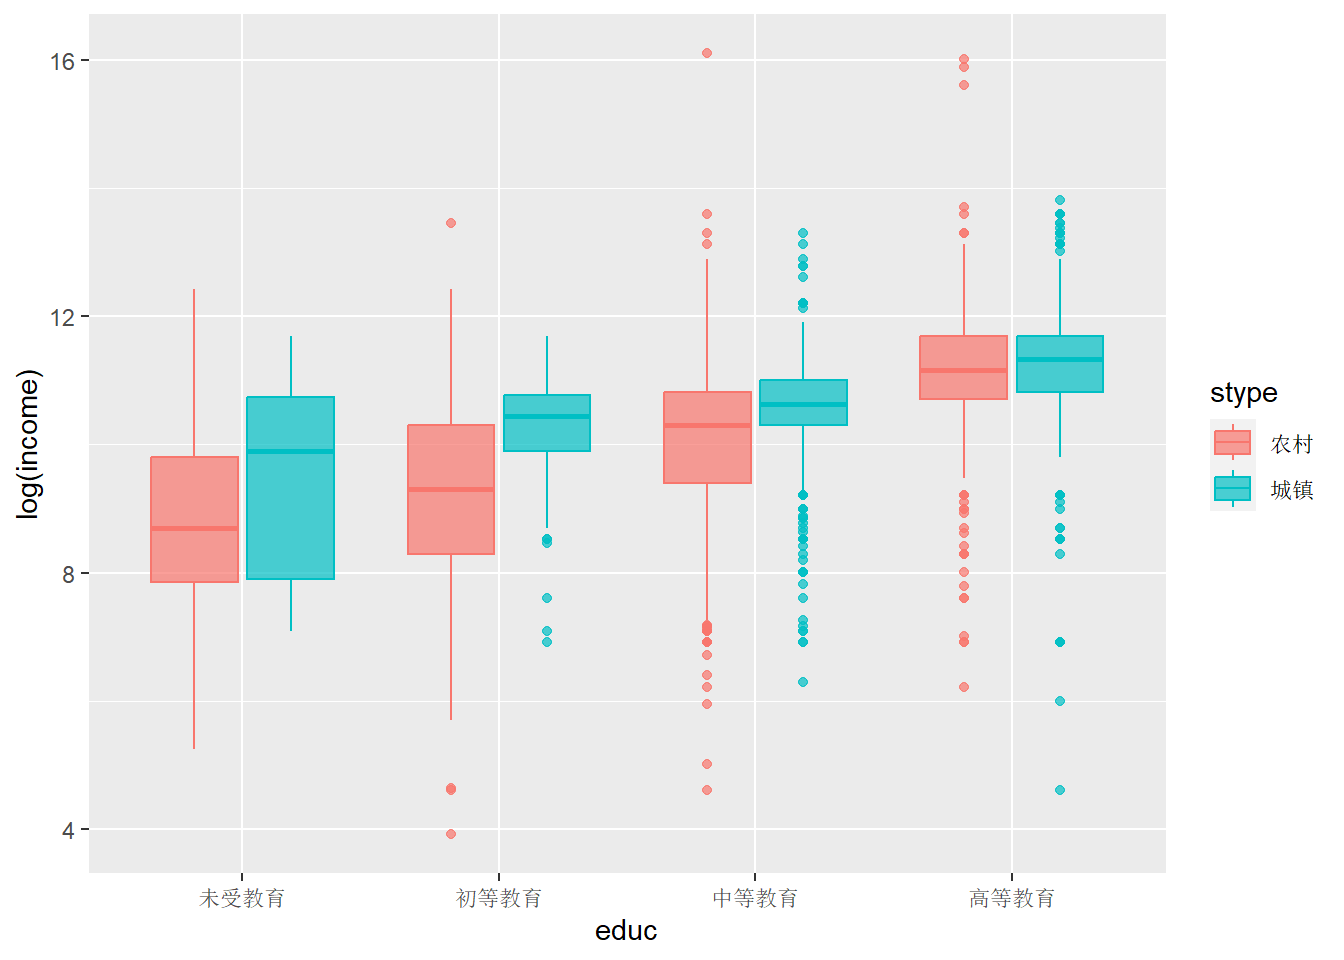
#添加标题、横纵轴标签
ggplot(data=core,
       aes(x=educ,y=log(income),fill=stype,color=stype))+
  geom_boxplot(alpha=0.7)+
  labs(x="受教育状况",y="2020年个人收入",title="受教育状况和个人收入关系分布箱线图")
## Warning: Removed 624 rows containing non-finite values (`stat_boxplot()`).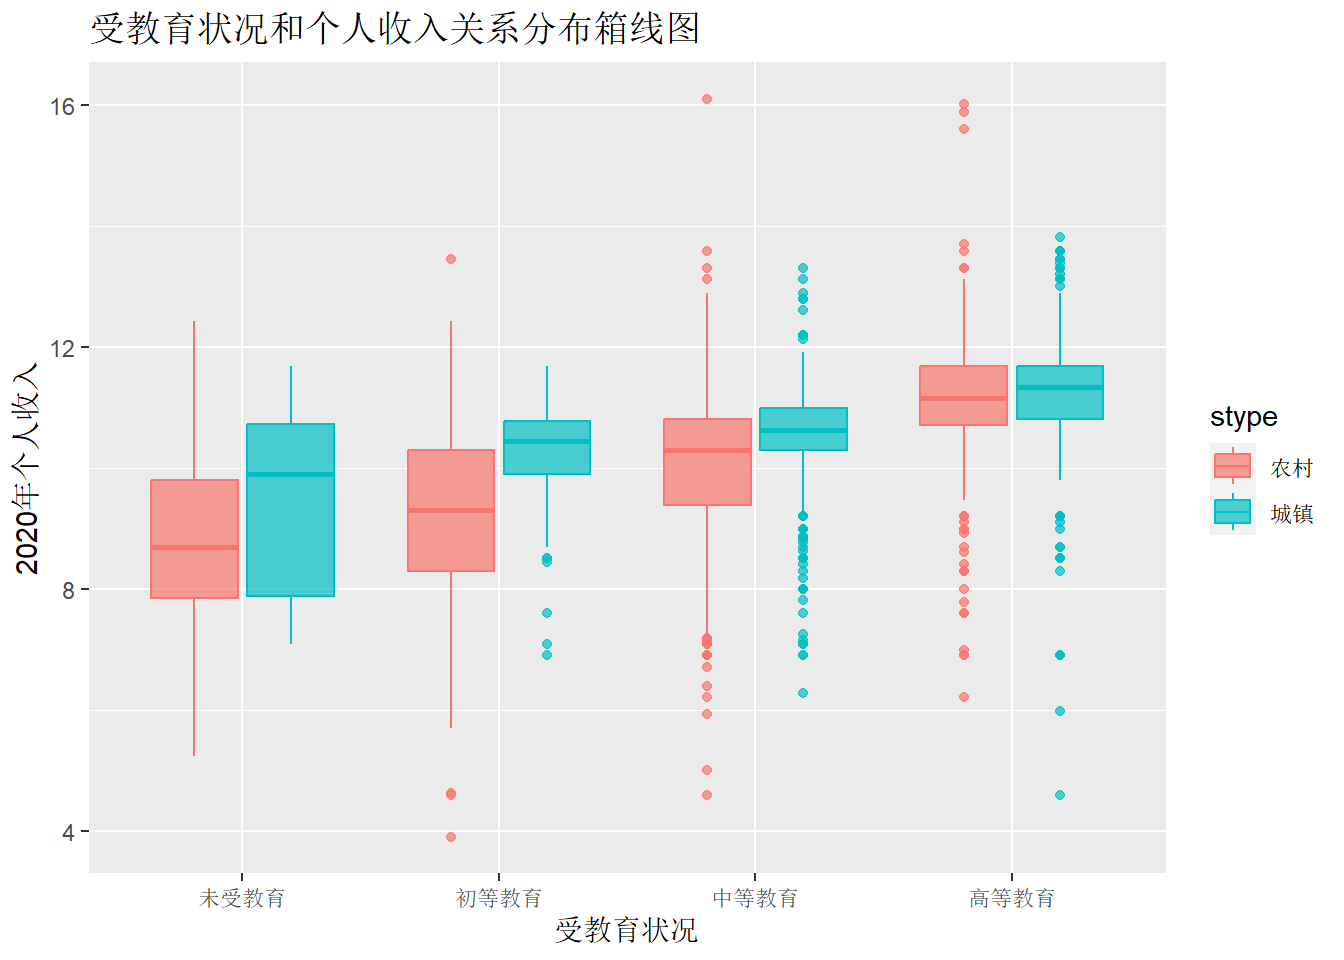
直方图
ggplot(data=core,aes(x=height))+
  geom_histogram(bins=30)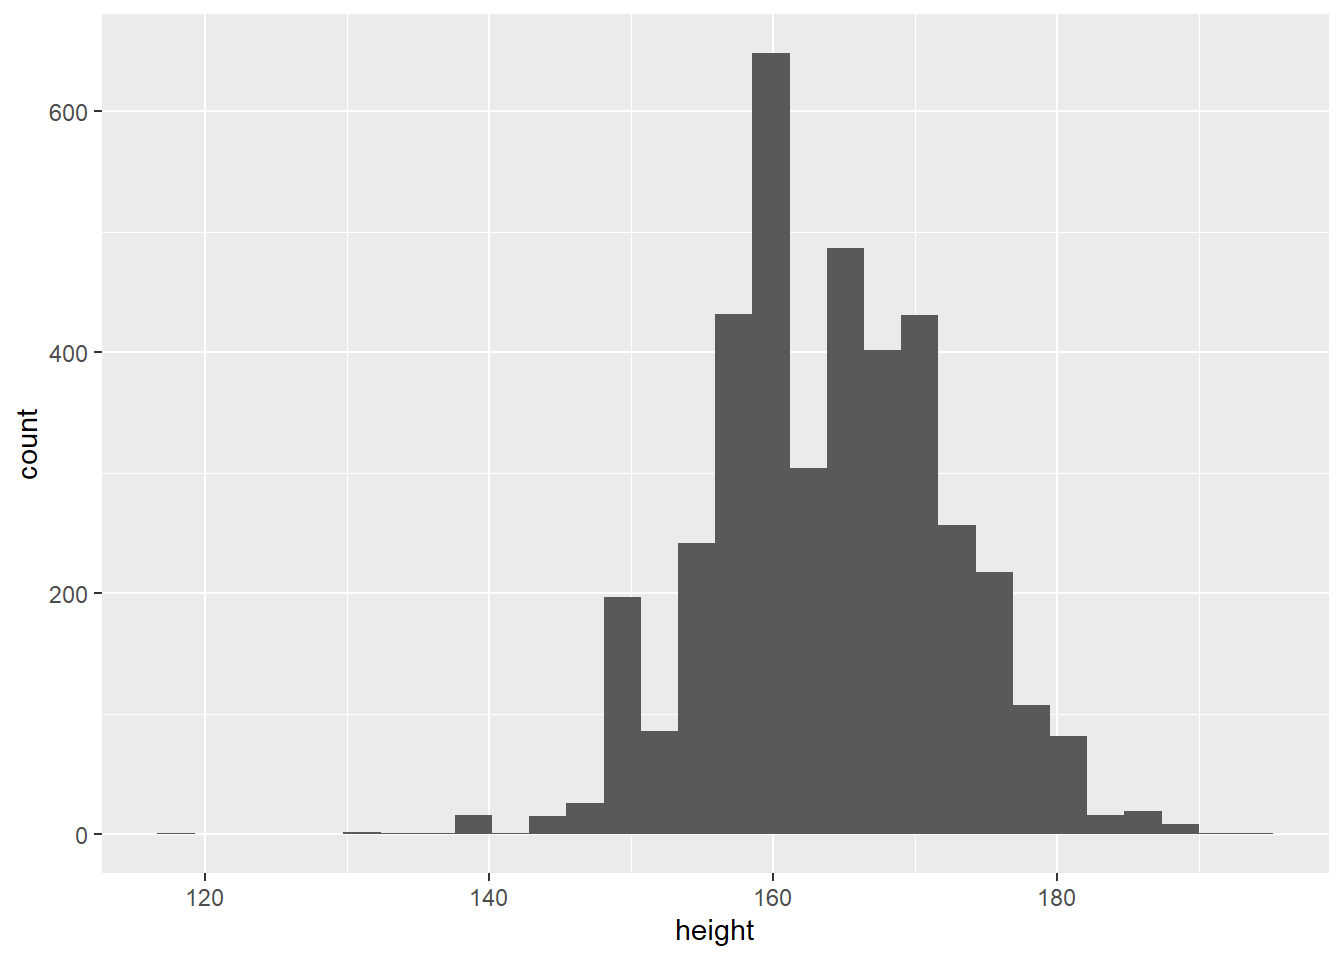
3.1.2 密度图 提琴图 山峦图 椭圆图 2D密度图
密度图
ggplot(data=core,
       aes(x=log(income),fill=educ))+
  geom_density(alpha=0.5)
## Warning: Removed 624 rows containing non-finite values (`stat_density()`).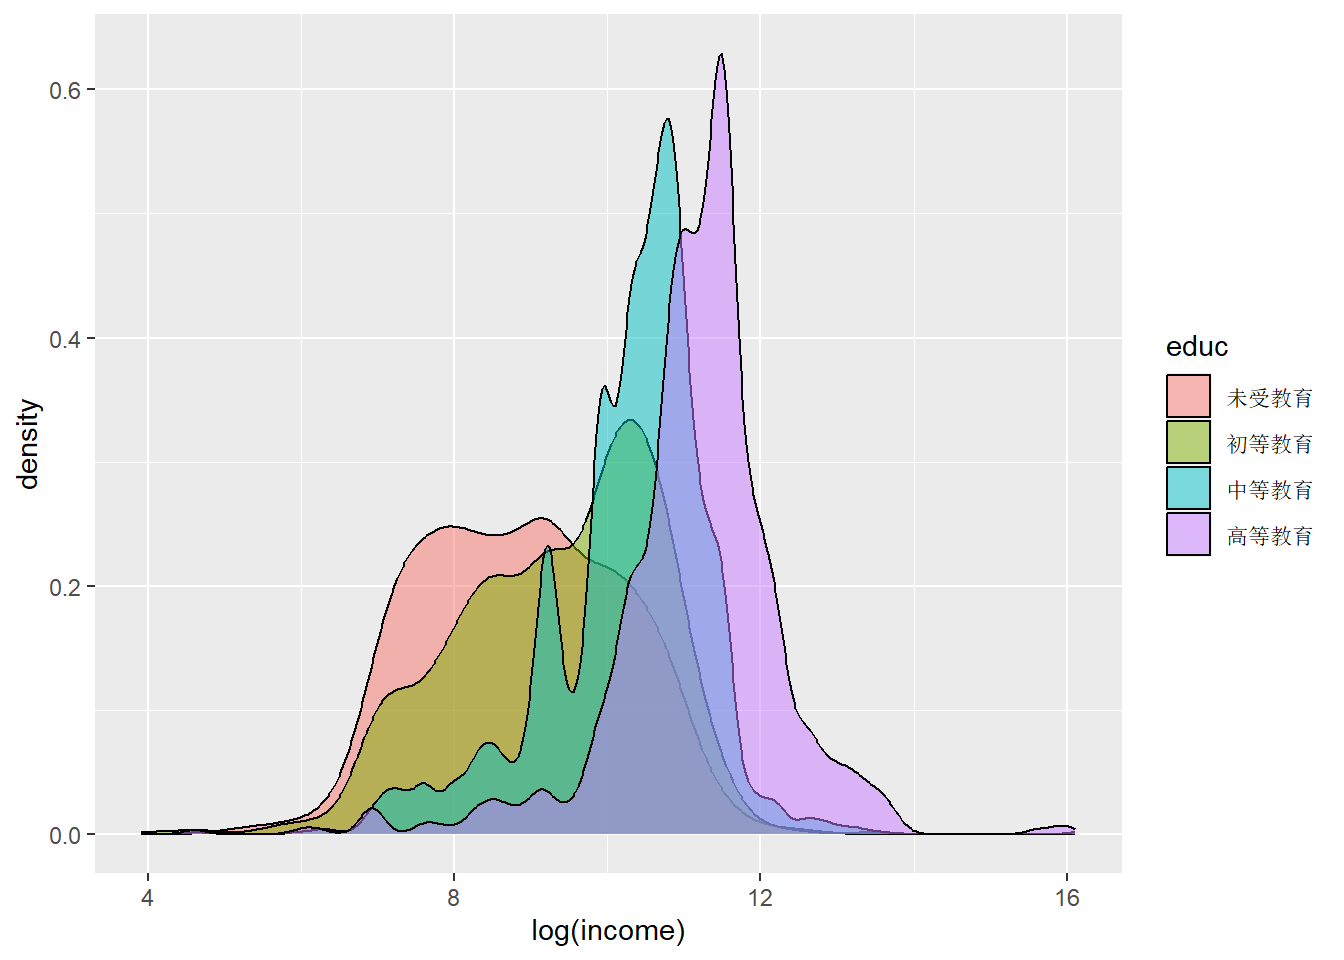
提琴图
ggplot(data=core,
       aes(x=educ,y=log(income),fill=educ))+
  geom_violin(alpha=0.5)
## Warning: Removed 624 rows containing non-finite values (`stat_ydensity()`).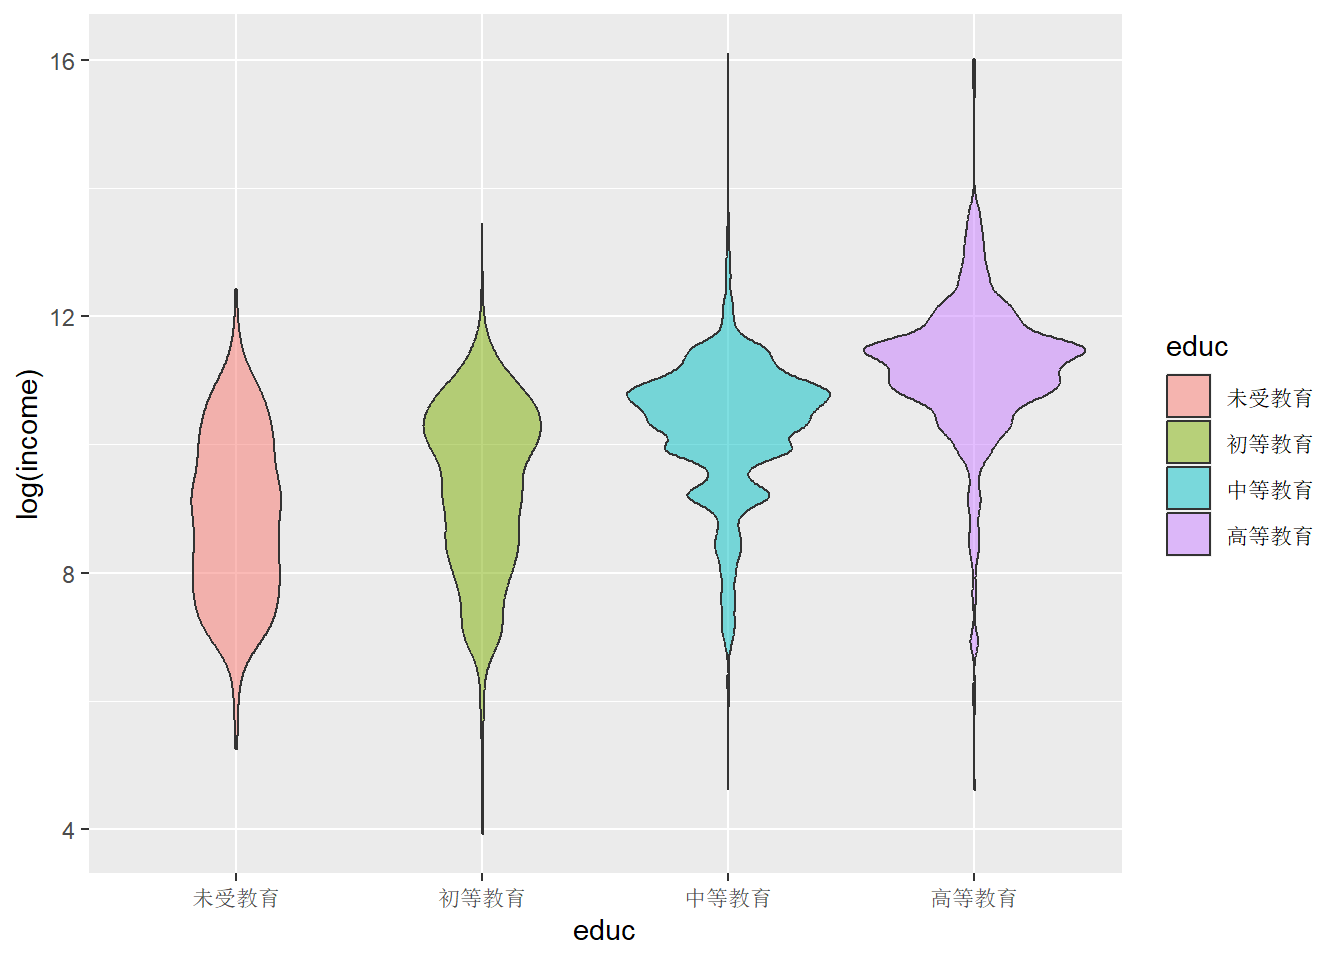
ggplot(data=core,
       aes(x=educ,y=log(income),fill=stype))+
  geom_violin(alpha=0.5)
## Warning: Removed 624 rows containing non-finite values (`stat_ydensity()`).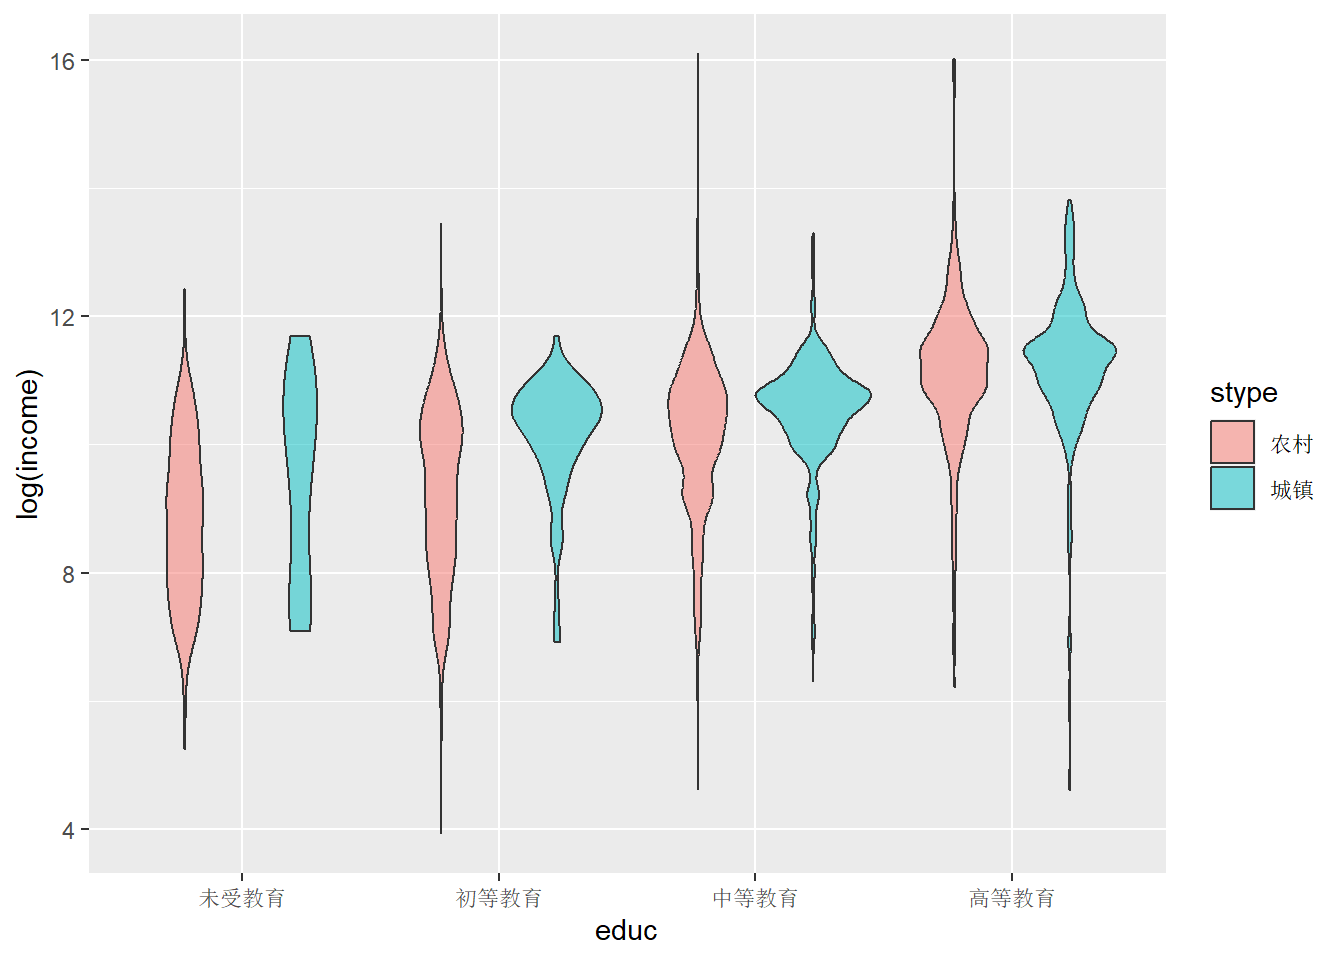
山峦图
x为连续变量,y为离散变量
library(ggridges)
core %>%
  ggplot(aes(x = height ,y = stype ,fill = gender)) +
  ggridges::geom_density_ridges()
## Picking joint bandwidth of 1.21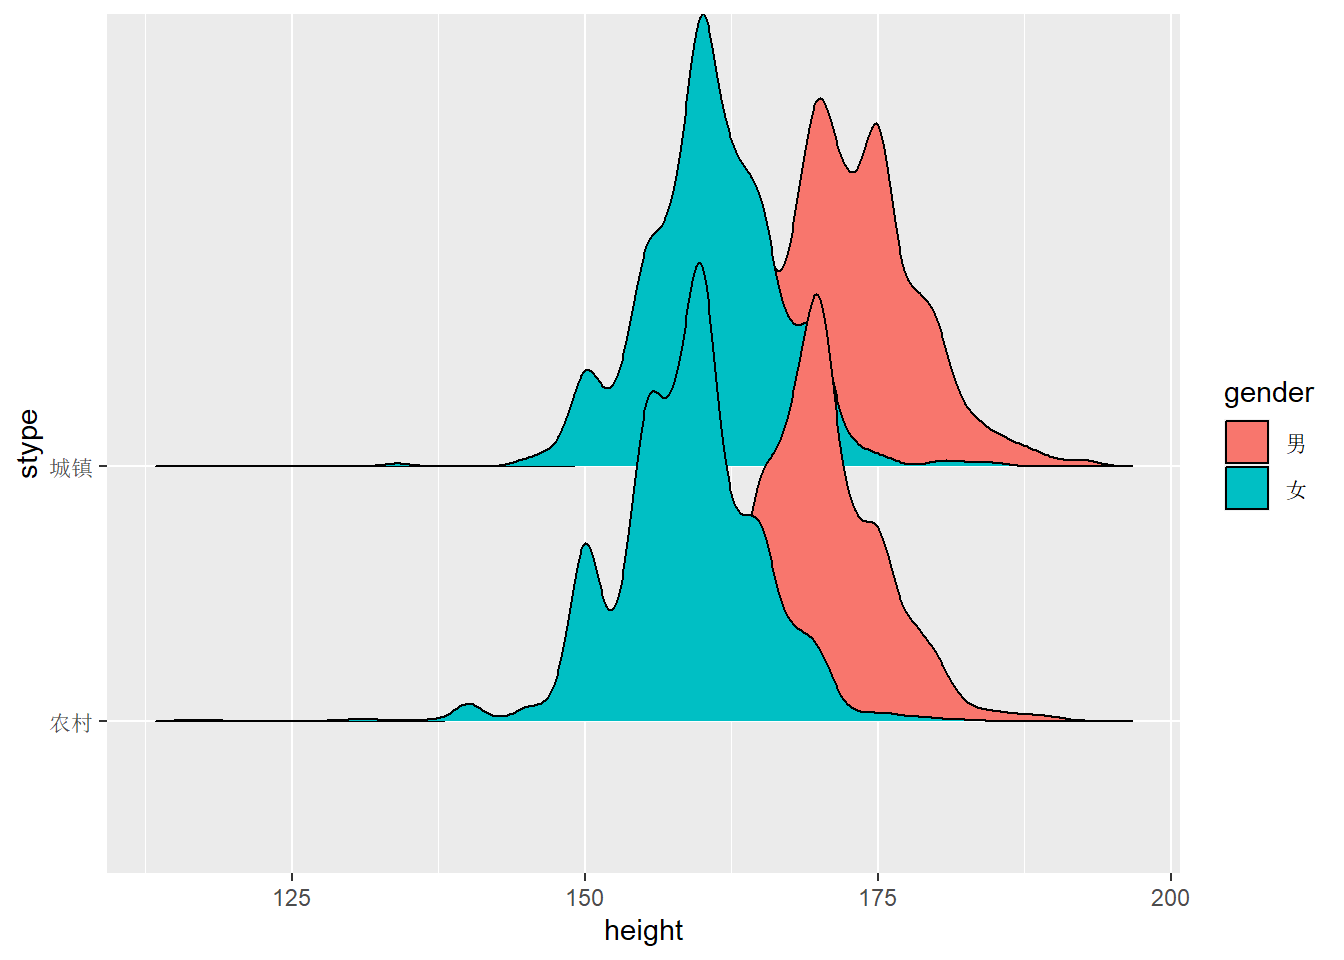
椭圆图
core %>%
  ggplot(aes(x = height, y = weight)) +
  geom_point() +
  stat_ellipse(type = "norm", level = 0.95) #level=0.95为95%置信区间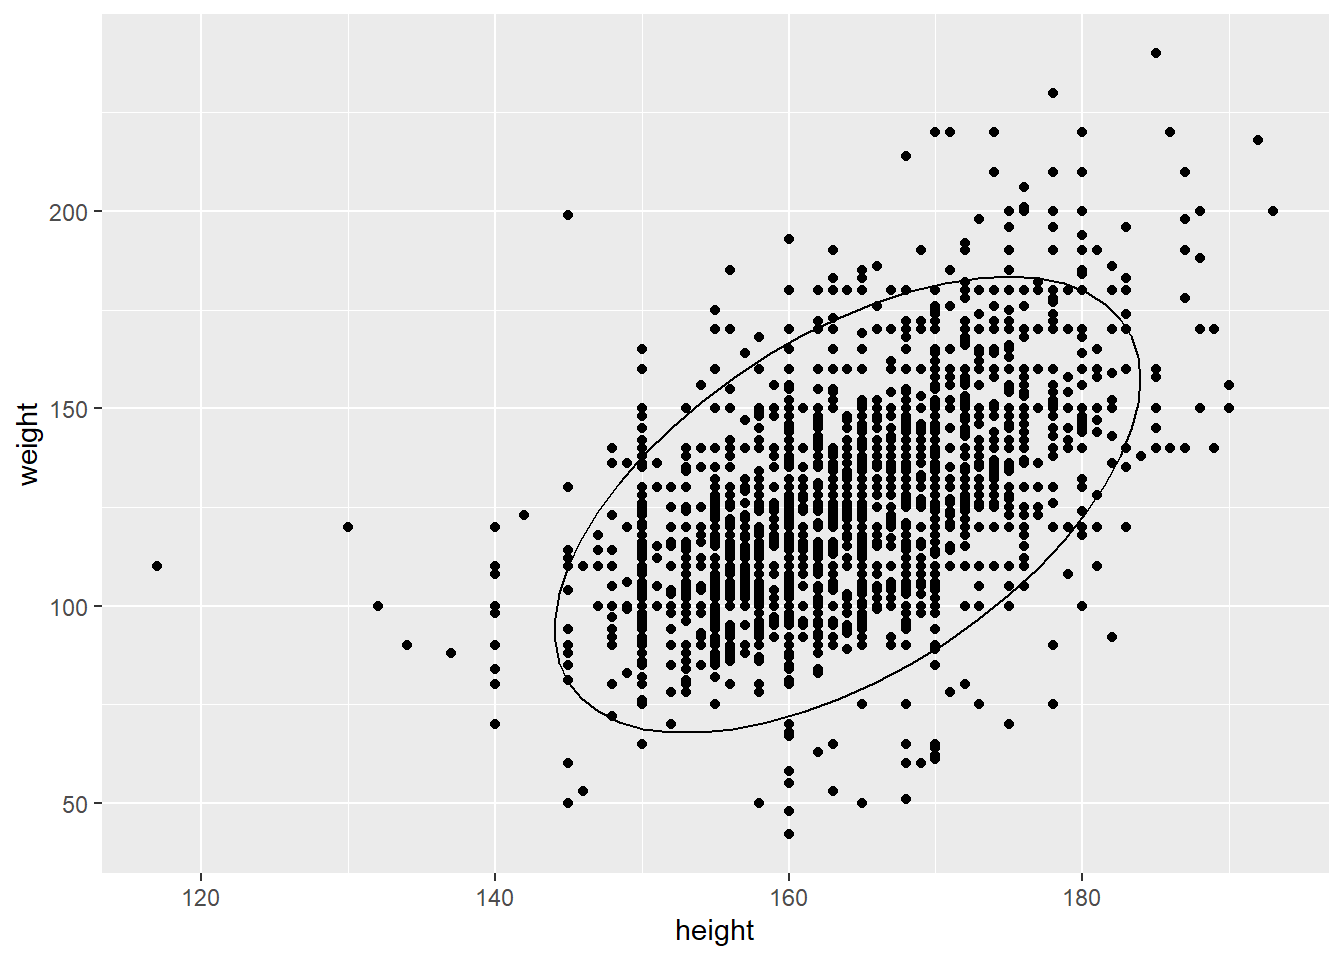
2D密度图
core %>%
  ggplot(aes(x =height , y = weight)) +
  geom_bin2d() #作长方形分块的二维直方图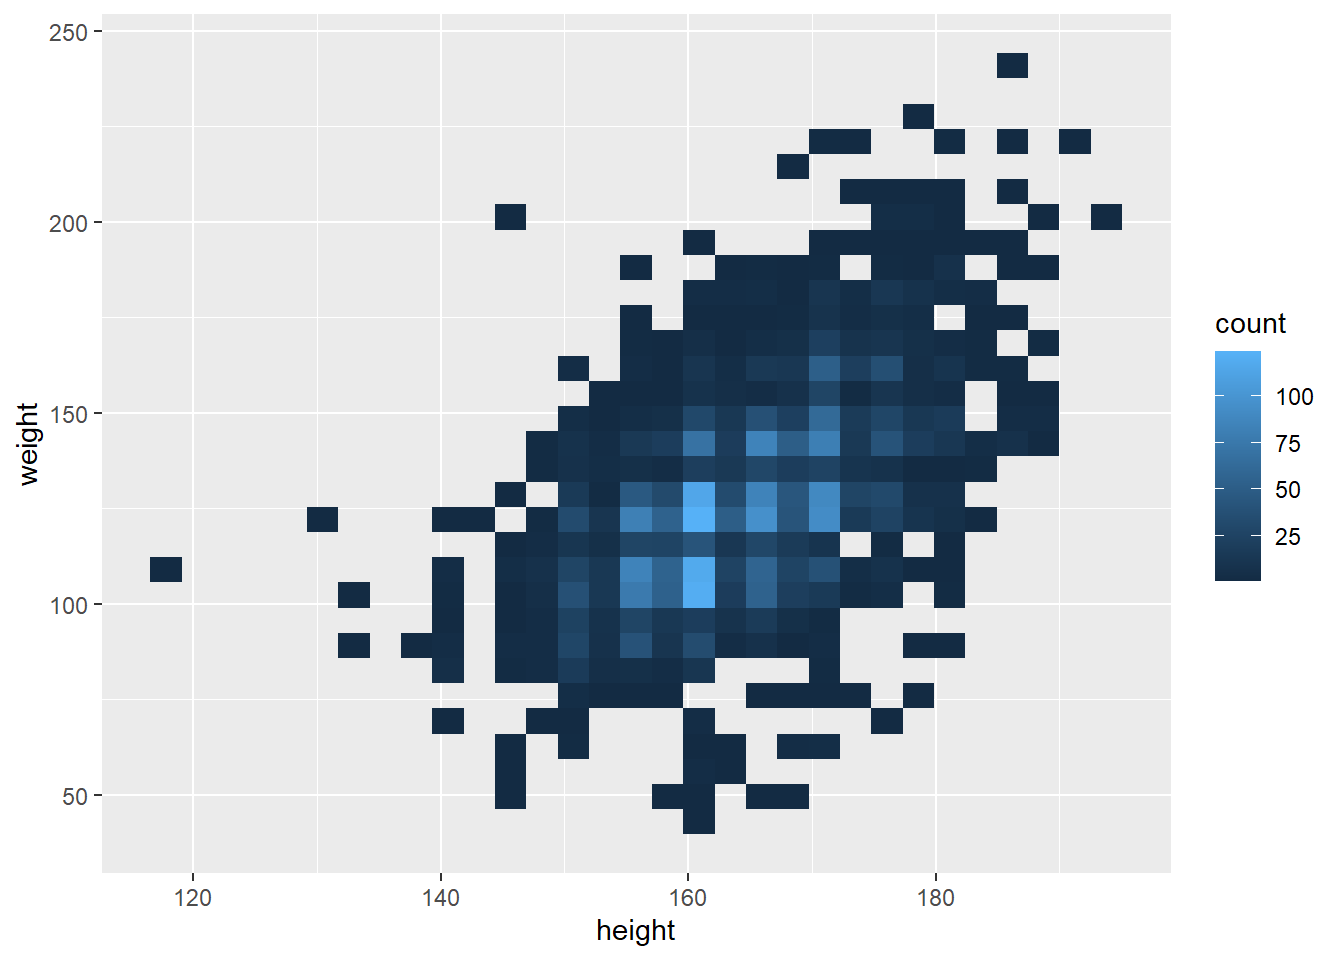
3.1.3 图的分面{facet_grid() / facet_wrap()}
core %>%
  ggplot(aes(x = log(income))) +
  geom_density() +
  facet_grid(. ~ stype)
## Warning: Removed 624 rows containing non-finite values (`stat_density()`).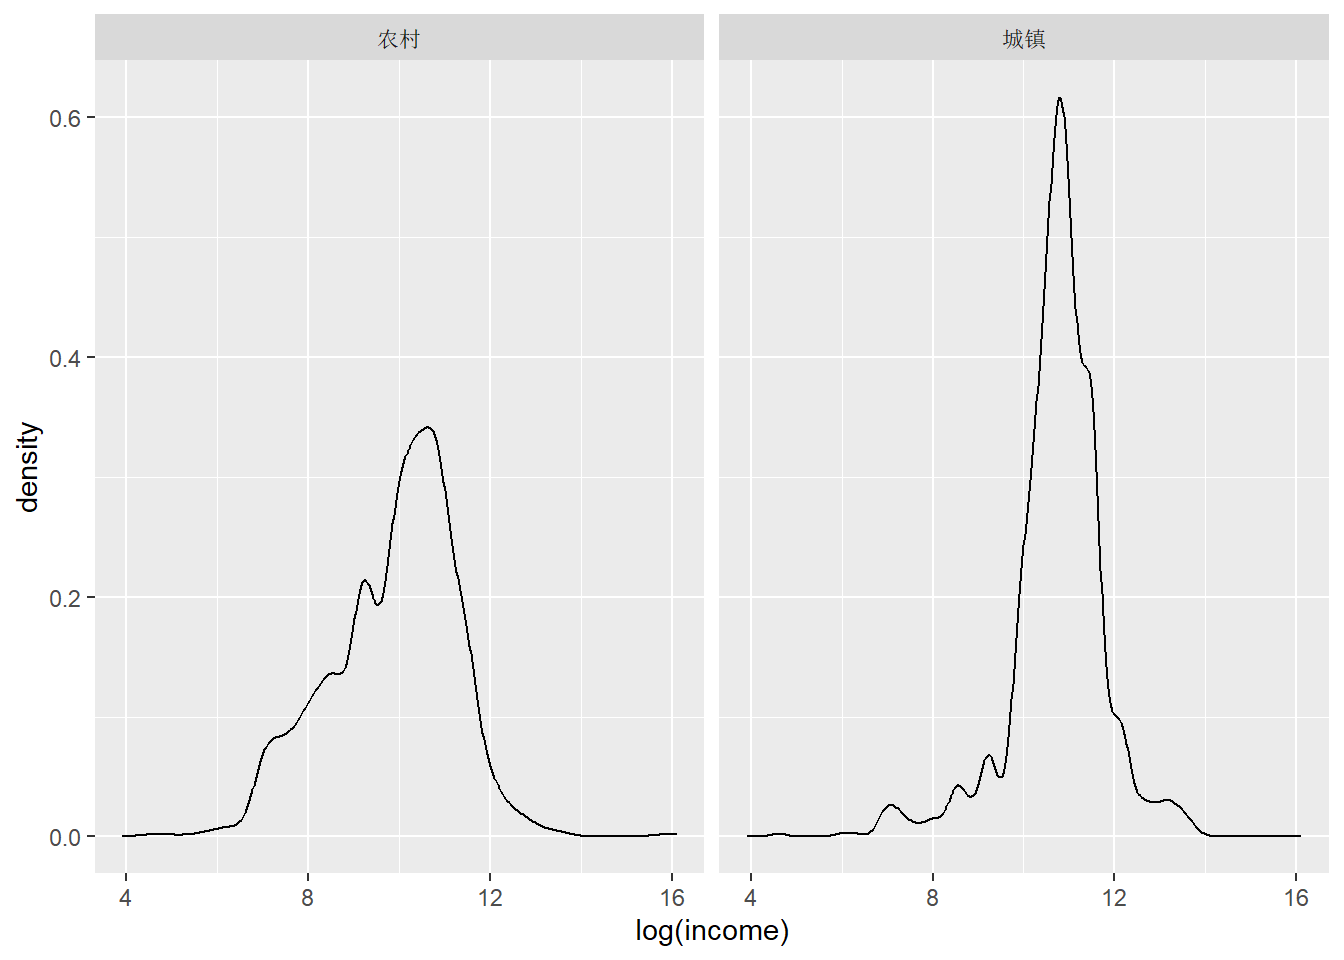
core %>%
  ggplot(aes(x = log(income), fill = gender)) +
  geom_histogram() +
  facet_grid(gender ~ .)
## `stat_bin()` using `bins = 30`. Pick better value with `binwidth`.## Warning: Removed 624 rows containing non-finite values (`stat_bin()`).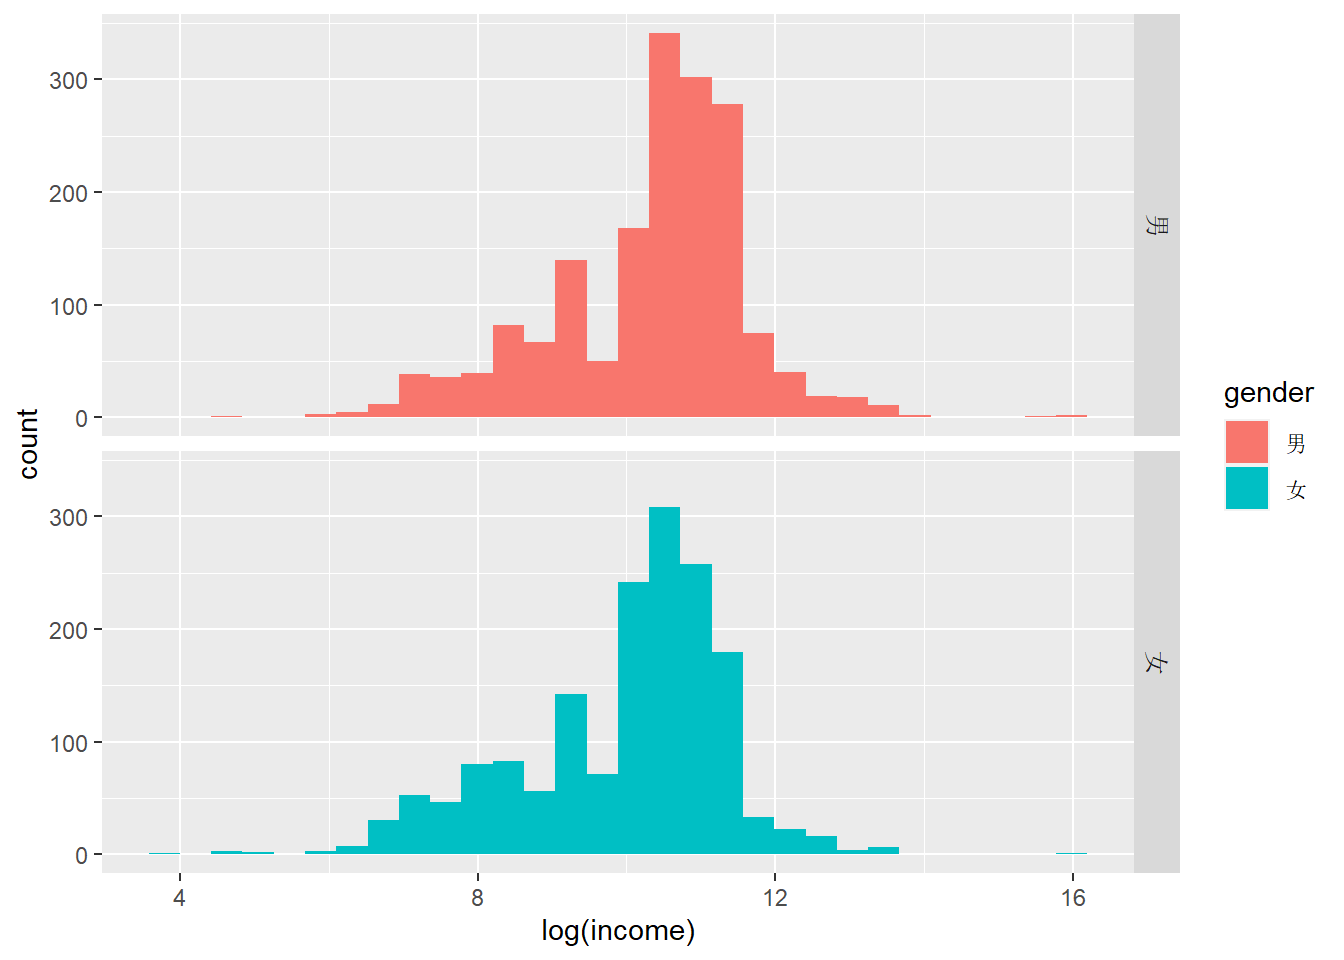
core %>%
  ggplot(aes(x = log(income), y = stat(density))) +
  geom_histogram(aes(fill = stype)) +
  geom_density() +
  facet_grid(stype ~ .)
## Warning: `stat(density)` was deprecated in ggplot2 3.4.0.
## ℹ Please use `after_stat(density)` instead.
## This warning is displayed once every 8 hours.
## Call `lifecycle::last_lifecycle_warnings()` to see where this warning was
## generated.## `stat_bin()` using `bins = 30`. Pick better value with `binwidth`.## Warning: Removed 624 rows containing non-finite values (`stat_bin()`).
## Removed 624 rows containing non-finite values (`stat_density()`).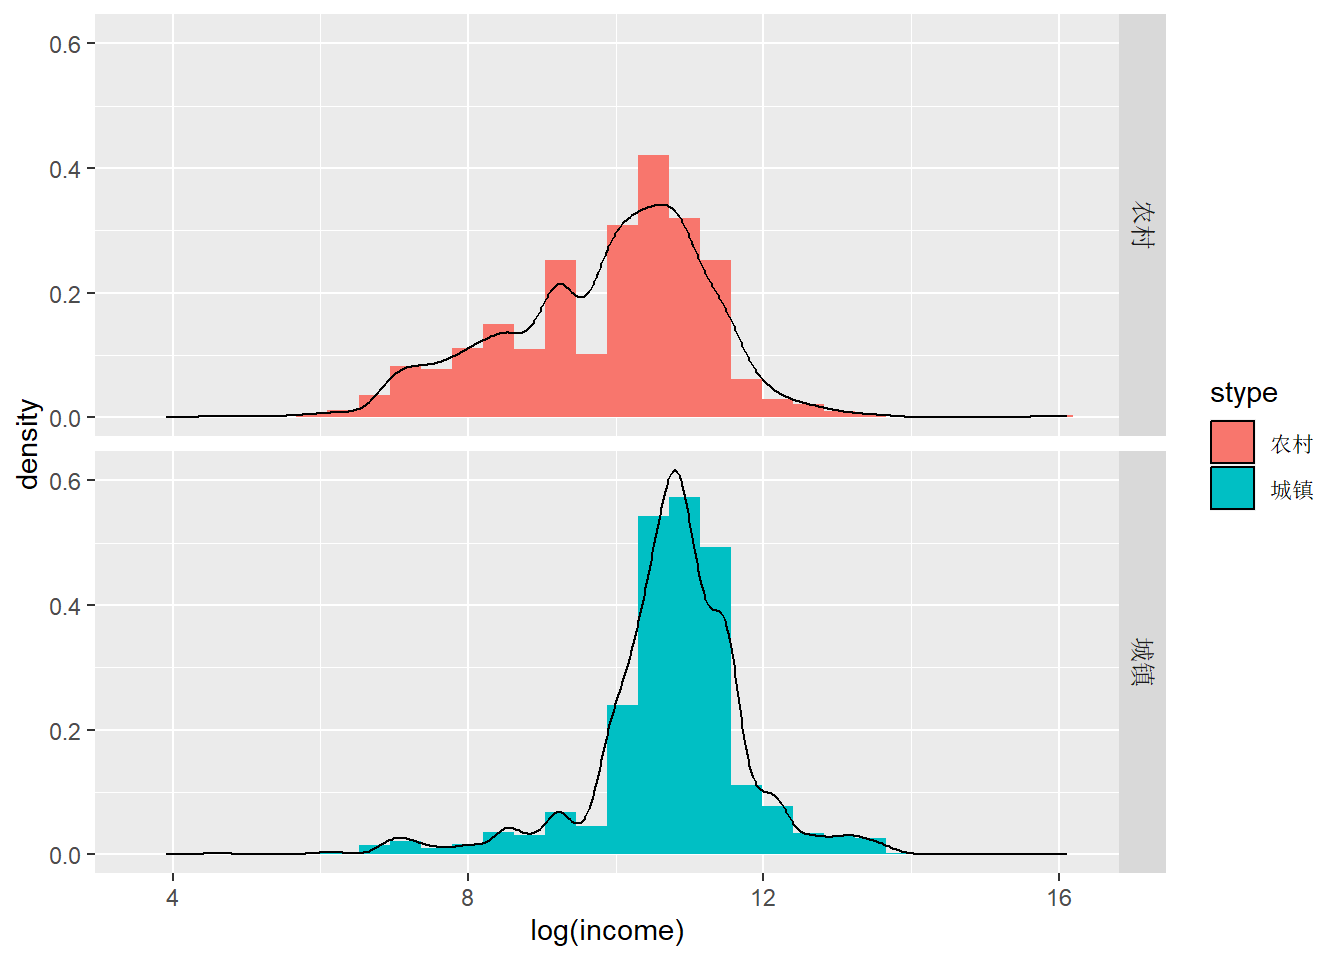
3.1.4 图上标注文本
#在图上用文本标注
library(ggforce)
core %>%
  ggplot(aes(x = height, y = weight)) +
  geom_point() +
  ggforce::geom_mark_ellipse(aes(
    filter = height > 1.75,
    label = "height >1.75"))
## Warning: Using the `size` aesthetic in this geom was deprecated in ggplot2 3.4.0.
## ℹ Please use `linewidth` in the `default_aes` field and elsewhere instead.
## This warning is displayed once every 8 hours.
## Call `lifecycle::last_lifecycle_warnings()` to see where this warning was
## generated.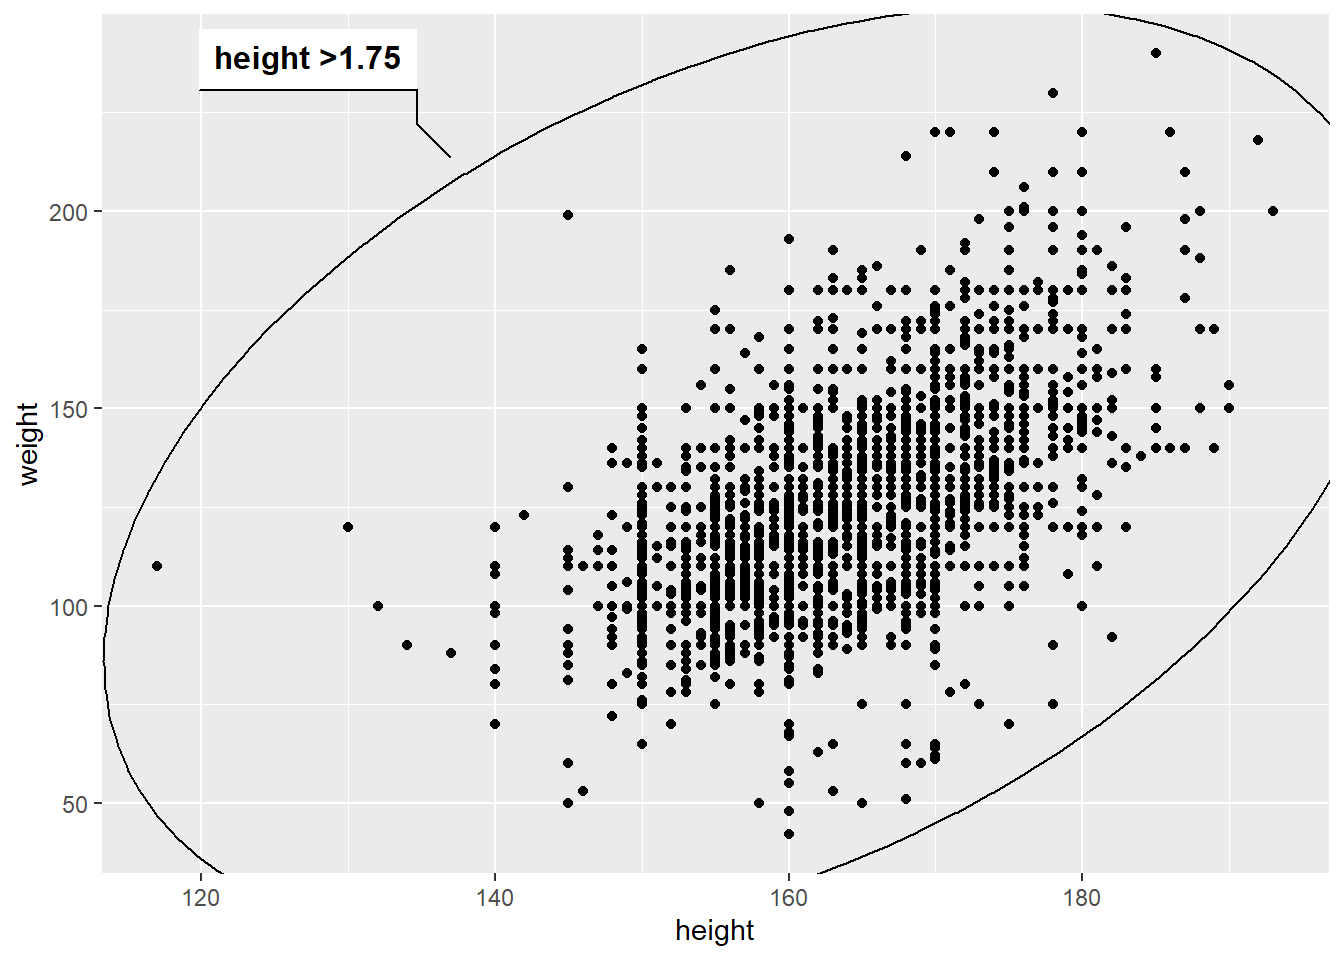
3.2 plotly
3.2.1 基本图形
library(plotly)##
## Attaching package: 'plotly'## The following object is masked from 'package:ggplot2':
##
## last_plot## The following object is masked from 'package:stats':
##
## filter## The following object is masked from 'package:graphics':
##
## layoutplot_ly(core, x = ~educ) %>%
add_histogram()plot_ly(core,x = ~height, y = ~weight)## No trace type specified:
## Based on info supplied, a 'scatter' trace seems appropriate.
## Read more about this trace type -> https://plotly.com/r/reference/#scatter## No scatter mode specifed:
## Setting the mode to markers
## Read more about this attribute -> https://plotly.com/r/reference/#scatter-mode